
.svg)


Stats are more than just numbers—they give you a clear picture of what’s working, what’s trending, and how your audience is engaging online.
From how often people like Instagram posts to which platforms are seeing the highest engagement, these insights can help you fine-tune your strategy.
We’ve gathered 60 key social media stats to guide you through the latest trends and make your marketing smarter. Let’s dig into the data and get started!
Top 60 Social Media Stats
Social Media Usage
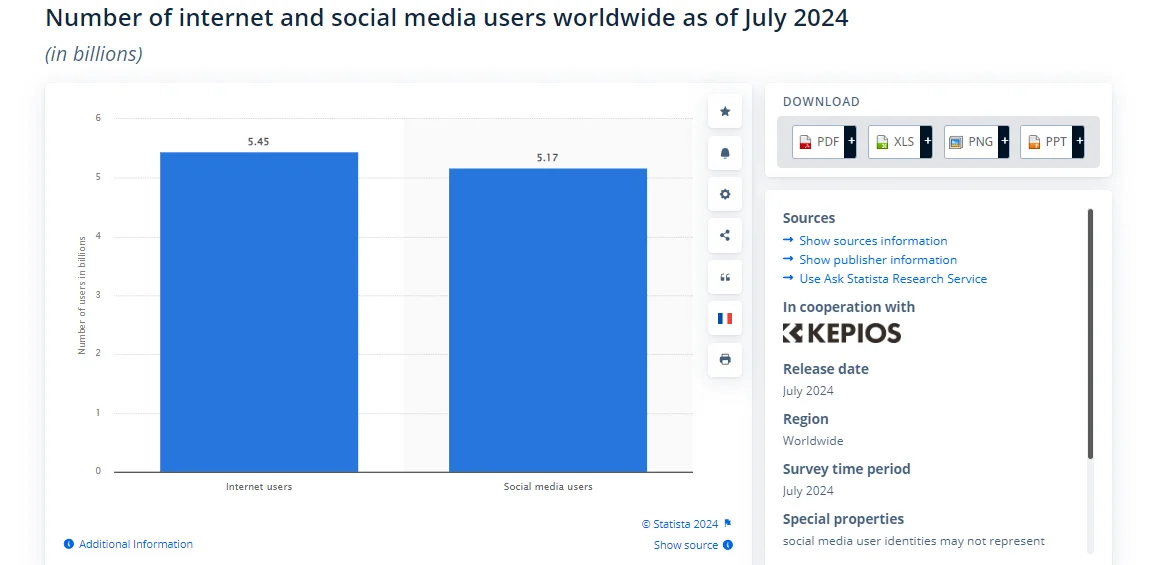
1. In 2024, there are an estimated 5.17 billion social media users worldwide, representing about 63.7% of the global population.
According to Statista, in 2024, a staggering 5.17 billion people—63.7% of the global population—are using social media. It’s clear that social platforms are a core part of daily life, creating endless opportunities for your brand to connect!
2. The average user is active on 6.7 different social networks each month, highlighting the need for a multi-channel marketing strategy.
According to Datareportal, the average social media user engages with 6.7 platforms monthly. This highlights the need for your multi-channel marketing strategy to reach and engage with diverse audiences wherever they are.
Engagement Stats
3. Users spend an average of 143 minutes per day on social media, indicating the potential for brands to capture attention.
According to Datareportal, users spend an average of 143 minutes daily on social media, totaling a staggering 720 billion minutes globally each day. That’s a huge opportunity for your brand to capture attention and engage with audiences on a daily basis.
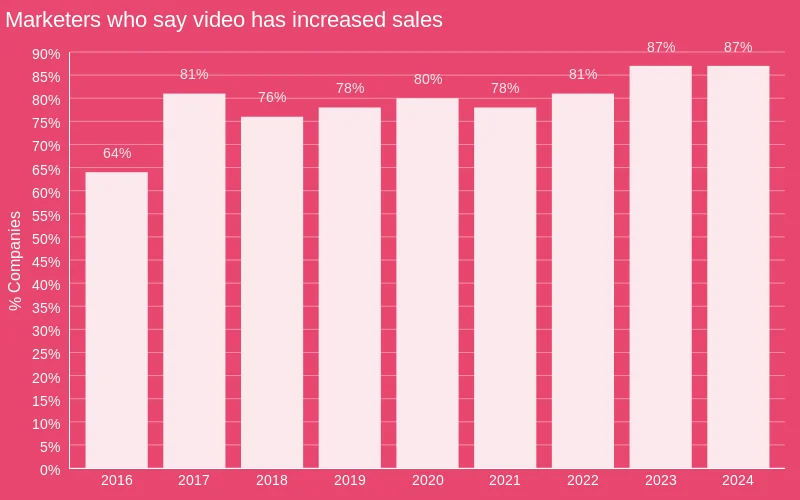
4. Video content is preferred by 87% of marketers, as it significantly boosts engagement and conversion rates.
Wyzowl reports that 87% of marketers credit video content with helping generate leads and increasing sales. This highlights just how powerful video is in boosting engagement and driving results for your business.
5. 29% of TikTok Installs See Daily Opens, Second Only to Instagram
The Power User Curve shows that 29% of TikTok's active installs saw daily opens, making it the second-highest engagement rate after Instagram's 39%. This shows TikTok’s impressive user retention and daily engagement, making it a prime platform for consistent brand interaction.
Social Media Advertising Statistics
6. Total ad spend on social media is projected to reach $219.8 billion in 2024, underscoring the importance of investing in paid strategies.
According to Statista, people are expected to spend about $219.8 billion on social media ads in 2024. This amount is predicted to increase slowly each year, at a rate of 3.86% from 2024 to 2028. This trend could elevate total spending to about $255.8 billion by 2028.
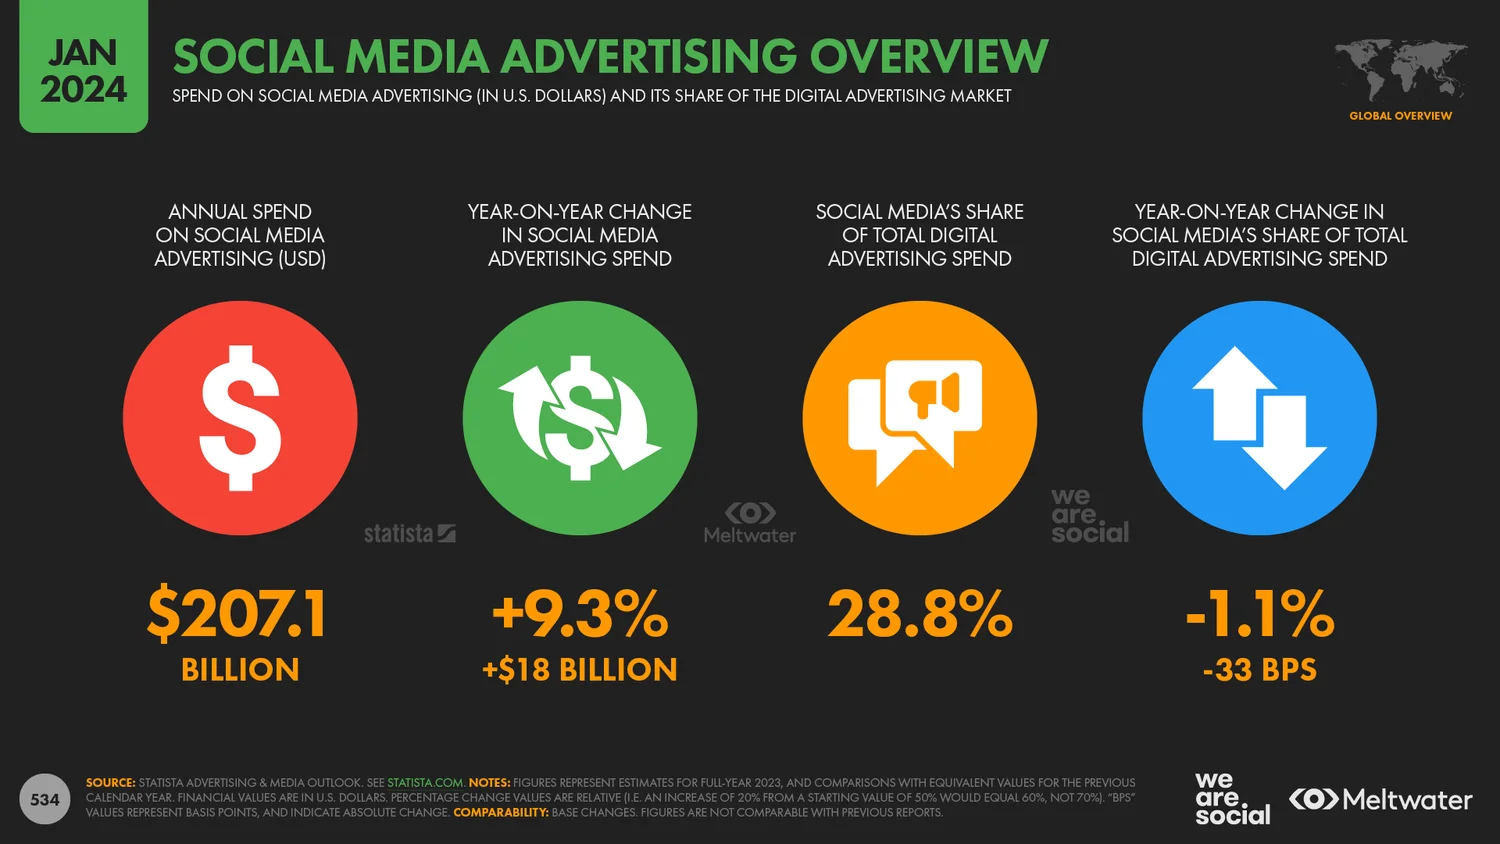
7. Social media ads account for 28.8% of all digital advertising spend, making it a crucial channel for marketers.
Datareportal reveals that social media ads comprise 28.8% of total digital advertising spending. This significant share highlights how essential social platforms are for your brand to effectively connect with your audience.
Key demographics on social media platforms
8. Facebook remains dominant with nearly 3.07 billion monthly active users, while Instagram boasts 2 billion users.
According to Statista, Facebook maintains its dominance with nearly 3.07 billion monthly active users, while Instagram attracts around 2 billion users. This data underscores the vital role these platforms play in your brand's digital marketing strategy.
9. Over 80% of marketers use Instagram for advertising, largely due to its high engagement and ROI potential.
According to Statista, over 80% of marketers leverage Instagram for advertising, making it the most popular platform after Facebook. Its high engagement rates and diverse global user base boost its effectiveness in your digital marketing campaigns.
10. 94.8% of Gen Z internet users use their mobile devices to access social media.
According to Statista, 94.8% of Gen Z internet users access social media through their mobile devices. This shows how crucial it is for your brand to create mobile-optimized content to effectively reach and connect with Gen Z on their favorite platforms.
Emerging Platforms And Trends
11. TikTok boasted 1.5 billion monthly active users in 2023, with projections indicating growth to 1.8 billion by the end of 2024, reflecting a remarkable upward trend in user engagement.
BusinessofApps reports that TikTok had 1.5 billion monthly active users in 2023, with forecasts suggesting an increase to 1.8 billion by the end of 2024. This growth highlights TikTok's impressive rise in user engagement, especially as other platforms see stagnation, making it a key space for your brand to connect with audiences.
12. Short-form video content continues to dominate, with 73% of users indicating they enjoy discovering new products through TikTok.
HubSpot reveals that short-form video content remains king, with 73% of users enjoying product discovery on TikTok. This trend highlights TikTok's power as a platform for your brand to showcase products and engage with your audience effectively.
Instagram Statistics
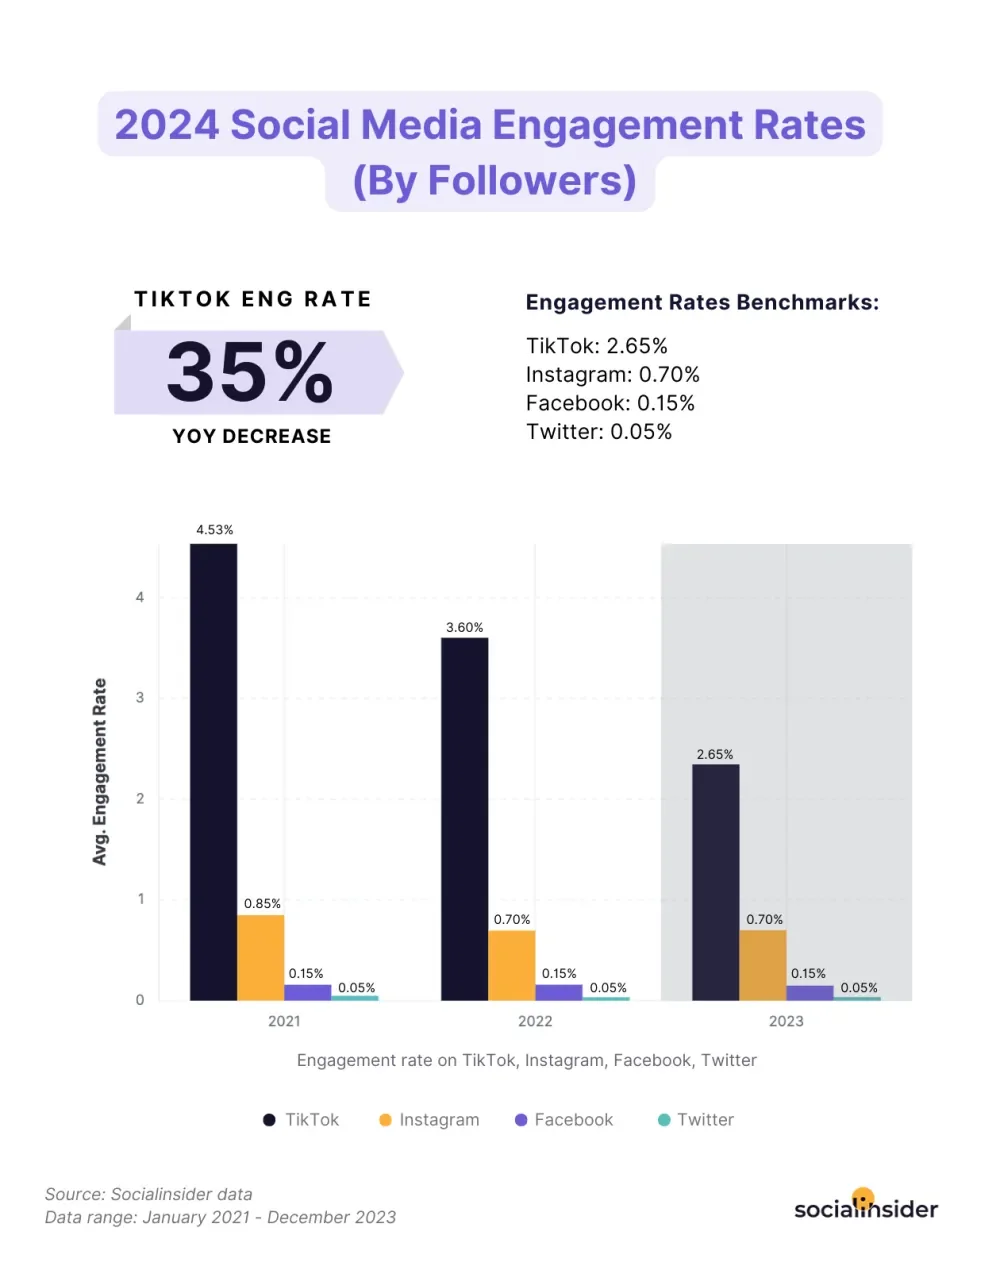
13. Instagram has an average engagement rate of 0.70%, significantly higher than Facebook's 0.15%.
Socialinsider reports that Instagram has an average engagement rate of 0.70%, which is nearly five times higher than Facebook's 0.15%. This gap shows a great chance for your brand to boost audience interaction on Instagram.
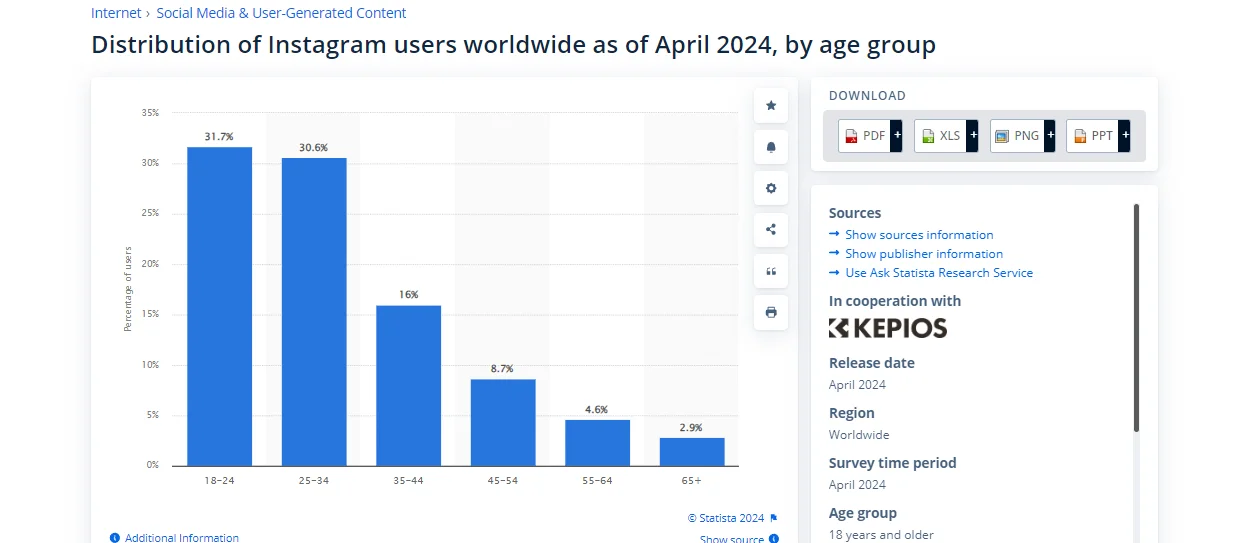
14. Instagram Dominates Among 18 to 34-Year-Olds.
Statista reports Instagram is particularly popular with younger users, especially those aged 18 to 34, who represent over 60% of its user base. This focus on young adults makes Instagram a perfect platform for you to connect and engage if your target audience is in this age group.
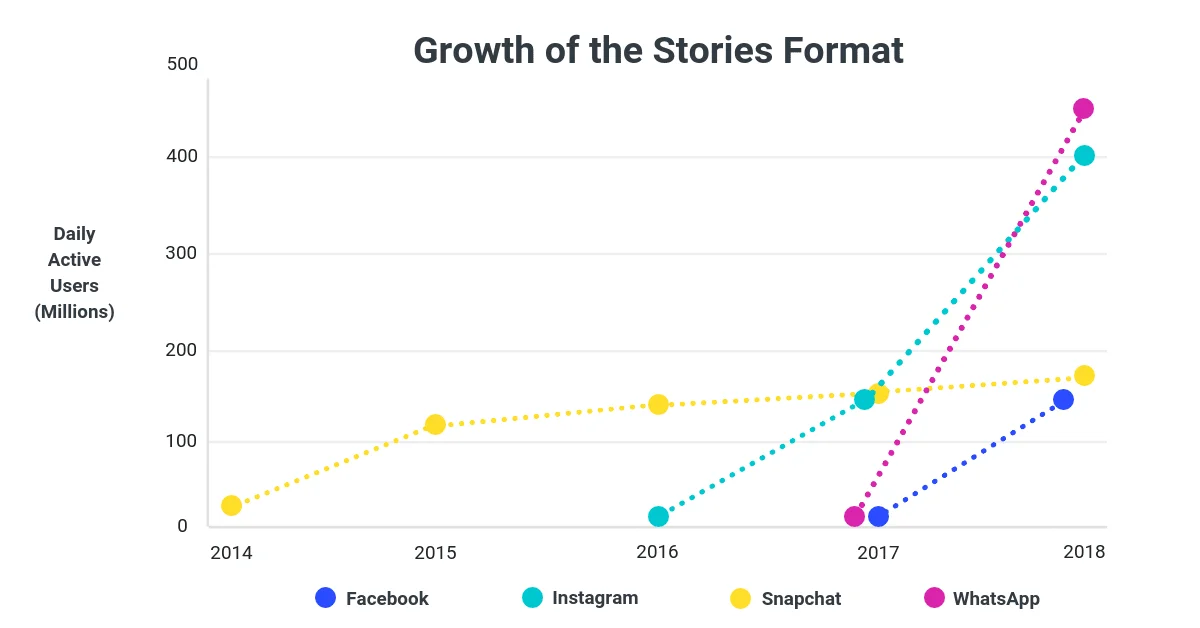
15. Instagram Stories’ ad revenue rose to $20.03 billion in 2023.
Instagram Stories raked in $20.03 billion in ad revenue in 2023. This proves just how powerful Stories can be for you. With the right strategy, you can tap into this growing opportunity and boost your visibility and engagement.
16. 80% of Instagram users are outside of the US.
TechCrunch reports that 80% of Instagram users are outside of the US. This global user base offers you a unique opportunity to engage with audiences around the world. By tailoring your content to resonate with diverse cultures and preferences, you can effectively expand your reach and connect with international consumers on this popular platform.
17. There are over 200 million business profiles using Instagram worldwide in 2021.
In 2021, there were over 200 million business profiles using Instagram worldwide. This vast presence highlights the platform's significance for you. By creating a business profile, you can access valuable tools and insights to enhance your marketing strategies, engage with your audience, and drive growth in a competitive landscape.
User-generated Content Statistics
18. 79% of consumers say user-generated content highly impacts their purchasing decisions.
According to Stackla, 79% of consumers indicate that user-generated content significantly influences their purchasing decisions. This statistic highlights the power of authentic consumer experiences in shaping brand perceptions and underscores the importance for you to incorporate user-generated content into your strategies to build trust and drive sales.
19. Brands that utilize UGC see a 28% increase in engagement compared to regular brand content.
A study by Comscore reveals that brands leveraging user-generated content experience a 28% increase in engagement compared to traditional brand content. This substantial boost emphasizes the effectiveness of UGC in fostering deeper connections with audiences and improving overall brand interaction. Incorporating user-generated content can be a game changer for you as you aim to elevate your engagement strategies.
Influencers Marketing Statistics
20. 64% of Marketers report using micro-influencers.
According to the HubSpot 2024 Social Media Marketing Report, 64% of marketers have collaborated with micro-influencers, and 47% reported that these partnerships yield the greatest success. This trend highlights the effectiveness of micro-influencers in driving engagement and achieving marketing goals, making them a valuable asset for your brand's strategy.
21. Ad spending in Influencer marketing worldwide is forecasted to reach US$35.09bn by 2024.
According to Statista, global ad spending in influencer marketing is projected to hit $35.09 billion by 2024, with an annual growth rate of 9.91% expected until 2029, potentially reaching $56.28 billion. In 2024, the average ad spending per internet user in this market will be around $6.16.
Social Media ROI Statistics For 2024
22. Instagram Delivers the Third Highest ROI at 21%
According to HubSpot, you can enjoy a solid return on investment (ROI) of 21% with Instagram, making it the third highest among social media platforms. This proves Instagram's effectiveness for your brand's marketing efforts.
23. Companies leveraging video in their marketing strategies can experience a 49% faster growth rate in revenue.
According to a report by Aberdeen Group, businesses that incorporate videos into their marketing strategies experience 49% faster year-on-year revenue growth compared to those that do not. This statistic highlights the powerful effect of video content on conversion rates, reinforcing the importance for your brand to leverage video marketing to increase overall performance and drive sales.
TikTok Stats
24. On average, users dedicate 23.3 hours per month to TikTok.
According to Statista, individual users spend an average of 23.3 hours on TikTok each month. This significant time investment highlights the platform's potential for your brand to connect with audiences, showcase products, and engage users in creative ways.
25. 30% of Daily TikTok Users Engage with TikTok Shop.
Among daily TikTok users, 30% have already used TikTok Shop, while 33% haven't but are interested in it. For weekly users, 29% have tried TikTok Shop, and 26% show interest. This indicates a promising opportunity for your brand to enhance social commerce strategies on TikTok, as there’s a growing audience eager to shop in-app.
26. 26% of marketers are using TikTok.
Surprisingly, only 26% of marketers are currently using TikTok. With the platform offering significant opportunities for engagement, it's time to consider incorporating it into your social marketing strategies!
27. The Education Sector Leads in Engagement Rates on TikTok.
When examining engagement rates by industry, the education sector stands out with an impressive 4.90% engagement rate among followers on TikTok. Other sectors that also see high engagement include beverages, hotels and accommodations, airlines, and food.
28. TikTok is the leading platform for impulse purchases.
A significant 55% of TikTok users have made impulse purchases directly on the platform. In comparison, 46% of Instagram users, 45% of Facebook users, and 43% of X/Twitter users have also made similar purchases.
Significance of Mobile in Social Media
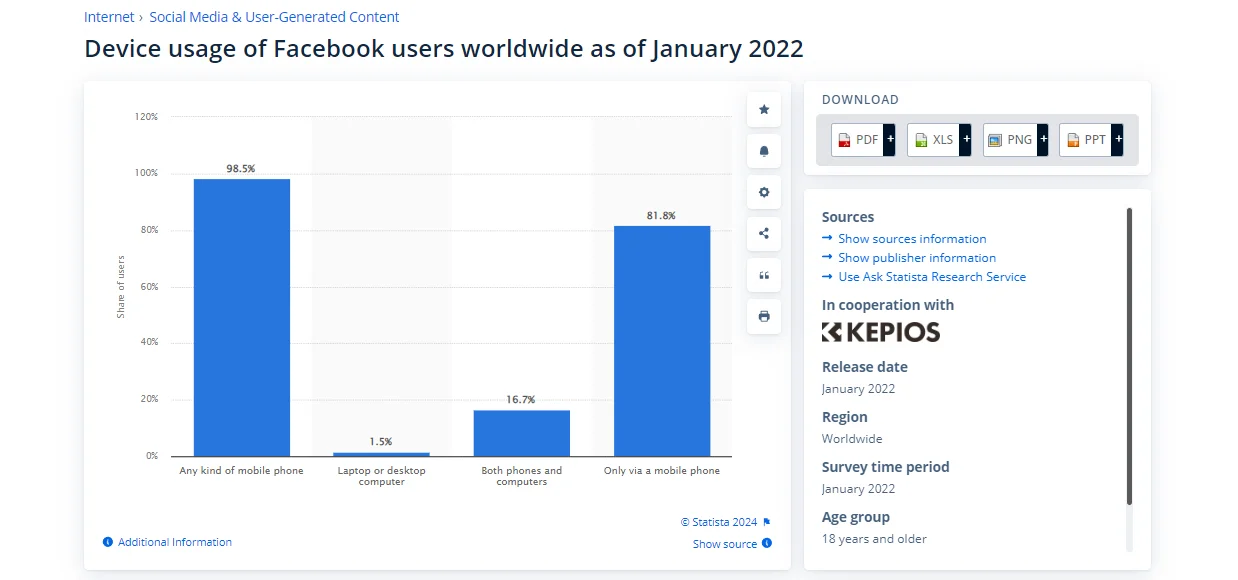
29. 98% of Facebook users access the platform via mobile devices, emphasizing the need for mobile-optimized content.
According to Statista, a staggering 98% of Facebook users access the platform via mobile devices. This highlights the importance of mobile-optimized content for your brand. To effectively engage your audience and maximize reach, make sure your content is designed with mobile users in mind!
30. Nearly 90% of all visits to YouTube come from a mobile device.
Statista reveals that nearly 90% of all visits to YouTube originate from mobile devices. This statistic highlights the need for you to prioritize mobile-friendly video content. Focusing on mobile optimization will help you connect with viewers where they are most active!
Social Media Platforms by Revenue Generation
31. Facebook generates approximately $134 billion in annual revenue, with advertising being its primary revenue stream.
According to Statista, Meta Platforms (formerly Facebook Inc.) generated approximately $134 billion in revenue in 2023, a significant increase from around $116 billion in 2022. This growth reflects a strong recovery and highlights the platform's continued ability to monetize its user base effectively. For your brand, understanding Meta's financial health can inform your marketing strategies and advertising investments on their platforms.
32. LinkedIn is increasingly becoming a revenue powerhouse, with over $16.4 billion generated in 2024.
According to Statista, LinkedIn's annual revenue for the fiscal year 2024 exceeded $16.4 billion, up from $14.9 billion in 2022. Acquired by Microsoft in 2016, LinkedIn has become a key platform for business networking and job searching.
Social media and customer service
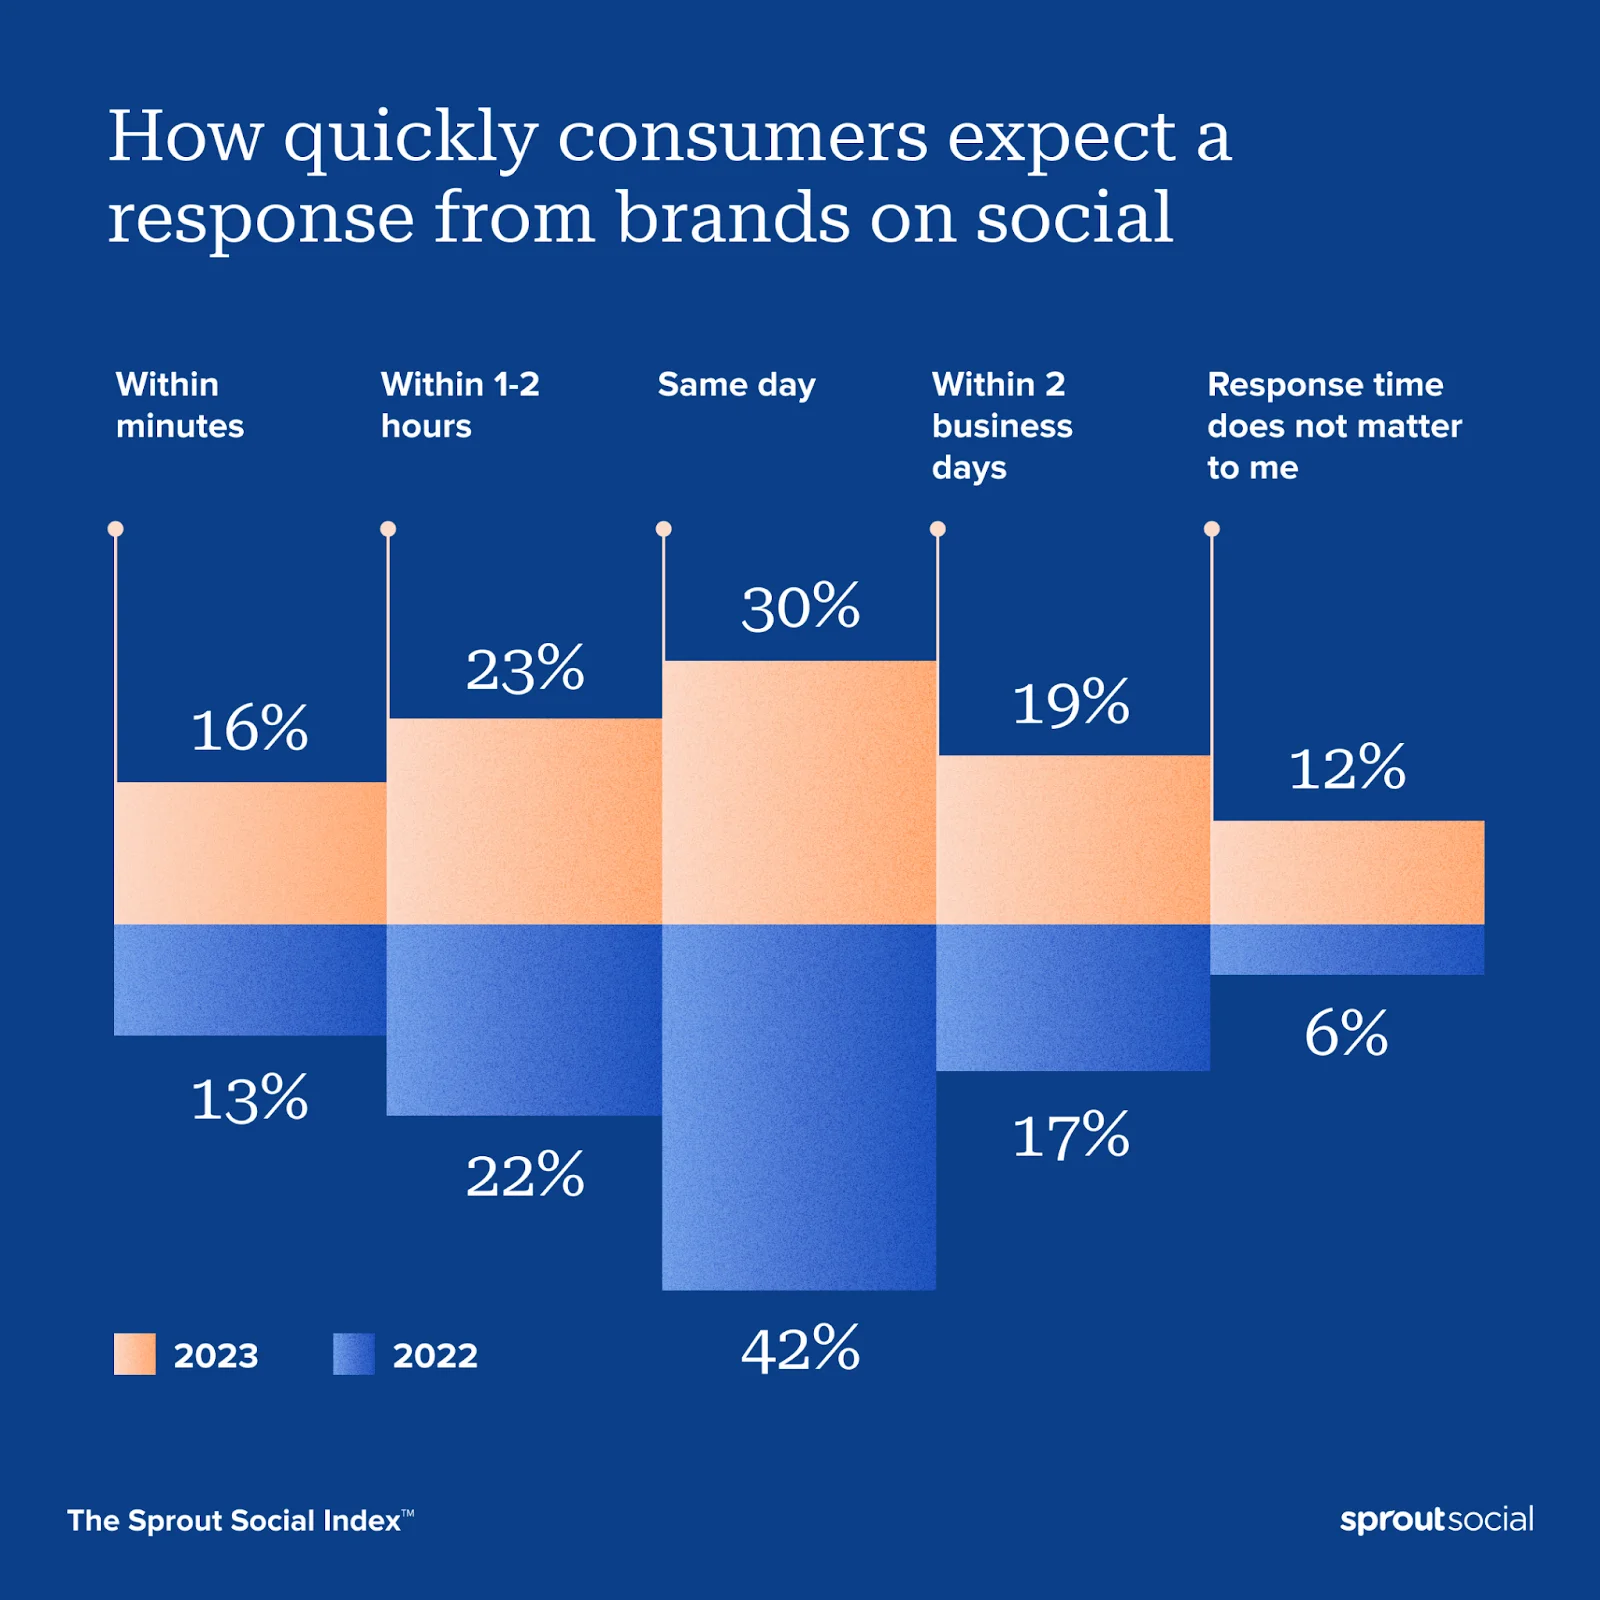
33. 70% of consumers expect a response from brands within 24 hours on social media.
According to the Sprout Social Index, 70% of consumers anticipate a response from brands within 24 hours when they reach out on social media. This expectation emphasizes the importance of timely engagement for your brand.
34. Brands that engage with their audience on social media see a 20% increase in customer satisfaction.
According to McKinsey, brands that actively engage with their audience on social media experience a 20% increase in customer satisfaction. This highlights the value of fostering meaningful interactions with your audience. By prioritizing engagement, your brand can enhance customer loyalty and create a more positive experience, ultimately leading to higher retention rates and advocacy.
Social Media Features
35. Instagram Stories are utilized by 500 million users daily, making them a vital feature for businesses to engage their audience.
According to Buffer, Instagram Stories are used by 500 million users every day, highlighting their significance for businesses looking to connect with their audience. This feature offers a dynamic way to share content, promote products, and foster engagement.
36. YouTube Shorts has also gained popularity, with 2 billion monthly active users engaging with short-form video content.
According to Statista, YouTube Shorts, which launched globally in June 2021, reached two billion monthly logged-in users as of July 2023. YouTube has aggressively promoted this short-video format by automatically redirecting users to Shorts upon app launch and introducing the YouTube Shorts Fund to incentivize creator involvement.
Ad performance metrics
37. Paid Social CTR: Average Click-Through Rates at 1.1-1.3%
According to Skai data, most ad spending occurs on Meta platforms like Facebook and Instagram. The average CTR in social feeds hovers around 1.1-1.3%, significantly outperforming historical data for display ads, which indicates a shift toward more engaging content on social media.
38. 85% of Marketers Will Use AI for Ad Text Creation in 2024
According to Hootsuite's 2024 Social Trends Survey, an impressive 85% of marketers plan to leverage AI to generate ad text from scratch this year, marking a 29% increase from the previous year. This trend underscores the growing reliance on AI technology in social media advertising, indicating that marketers recognize its potential to enhance creativity and efficiency in their campaigns.
YouTube Stats
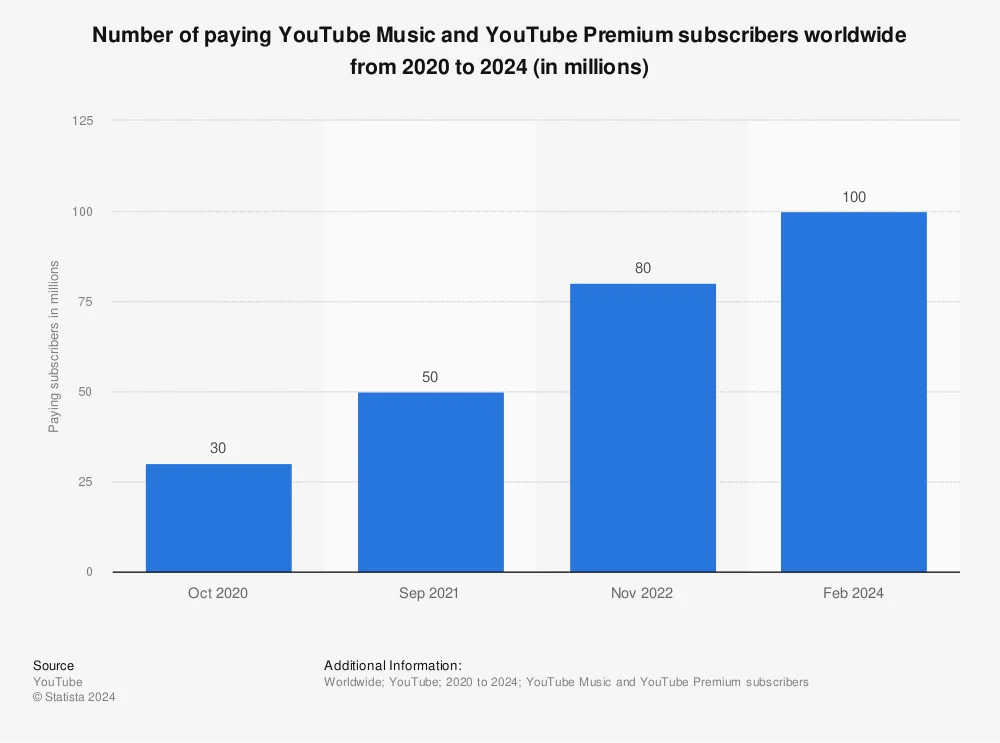
39. YouTube now has 100 million paying subscribers.
YouTube continues to grow, boasting 100 million paying subscribers for its Music and Premium services. This increase highlights the platform's success in attracting users willing to invest in good content and ad-free experiences.
40. YouTube Users Spend Over 28 Hours Monthly on the App.
According to the Digital 2024 report, users worldwide spend an average of 28 hours and 5 minutes on the YouTube mobile app each month. While this figure reflects only Android users, it underscores the increasing popularity of YouTube among mobile audiences.
41. YouTube Viewers Spend 1 Billion Hours Daily Watching on TVs.
Internal YouTube data reveals that viewers watch an impressive average of 1 billion hours of content daily on their TVs. This highlights the importance of producing high-resolution videos that are optimized for TV viewing.
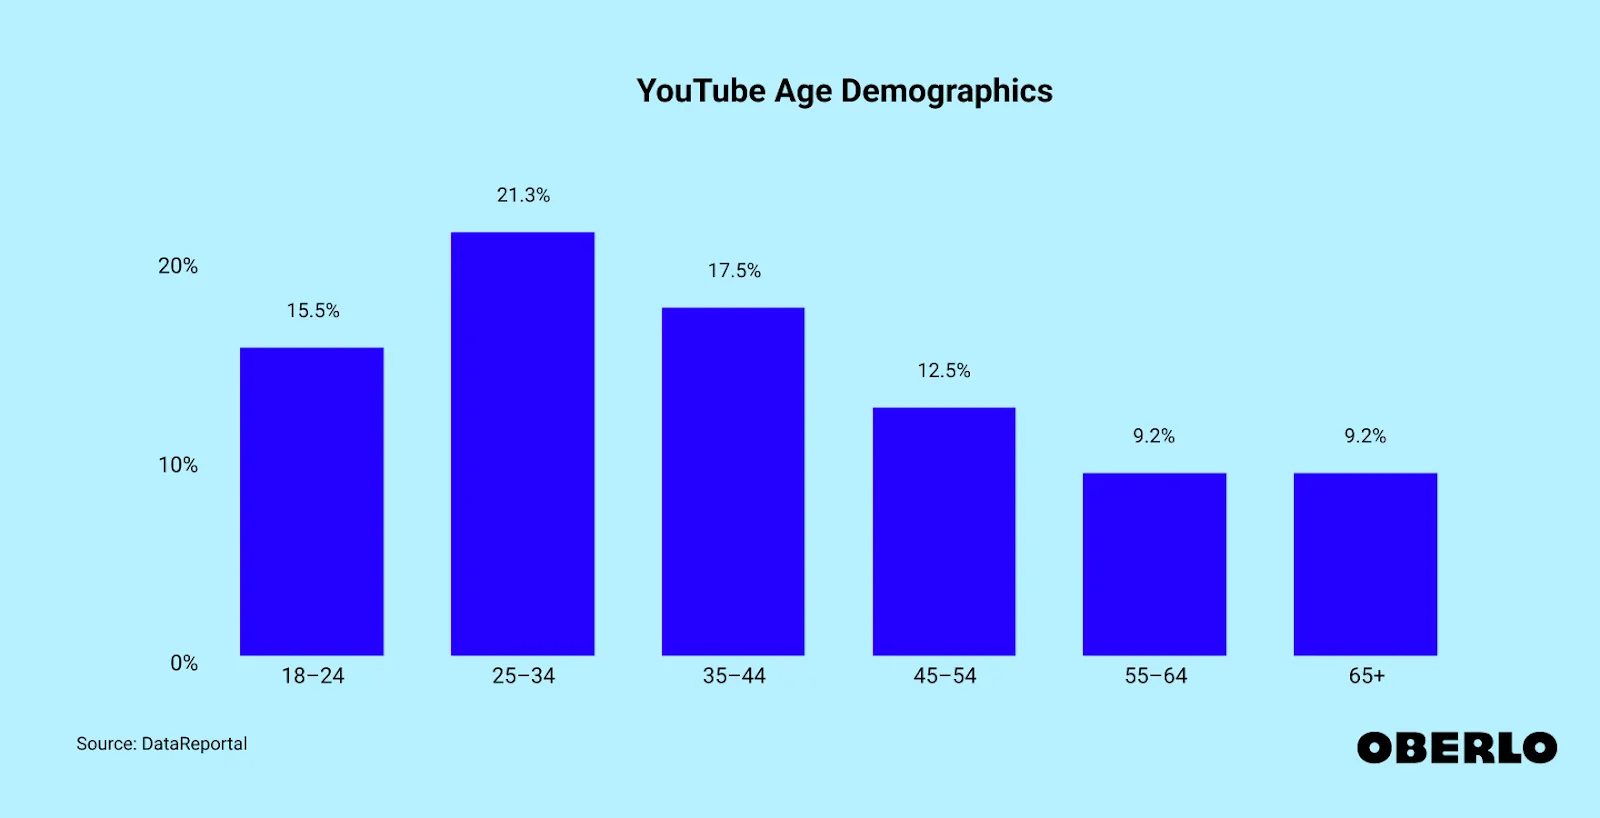
42. The Largest Age Group on YouTube: Ages 25-34.
Users aged 25 to 34 represent the largest age group on YouTube, making up 21.3% of its user base. The second largest group falls between 35 and 44, while young adults aged 18 to 24 comprise 15.5% of users.
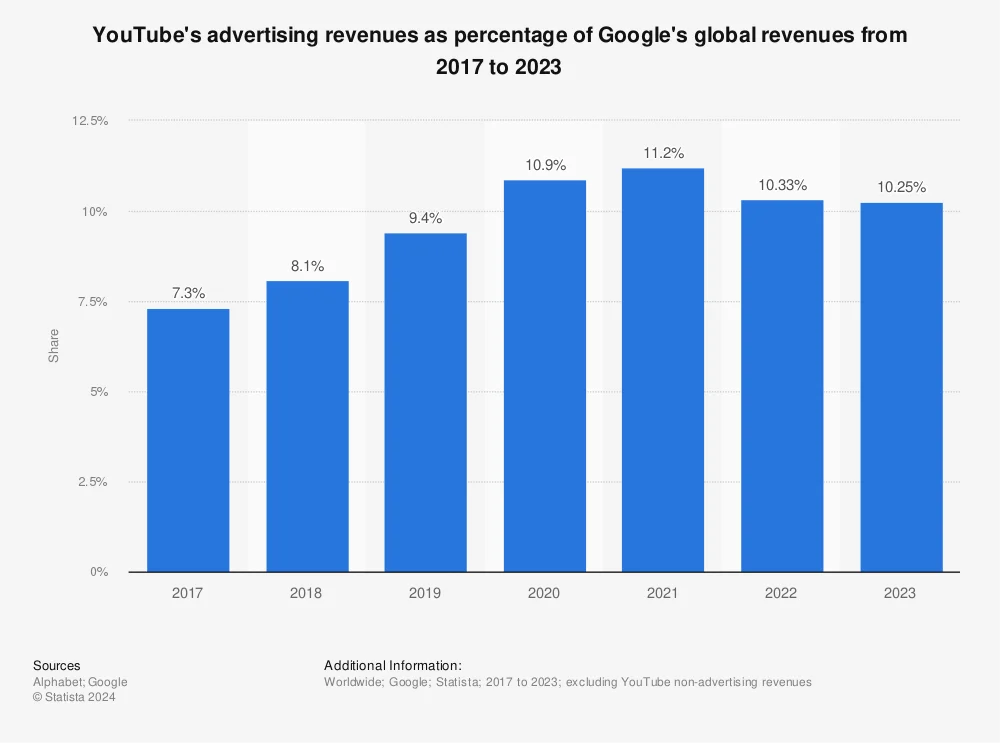
43. YouTube's Ad Revenue Surpasses $30 Billion in 2023.
In 2023, YouTube generated an impressive $31 billion in ad revenue, an increase from $29.2 billion in the previous year. This revenue accounts for 10.25% of Google's total global earnings.
44. YouTube Ads Outshine Linear TV Advertising in Relevance.
YouTube's advanced ad targeting features offer a personalized experience for viewers. A 2022 study found that 59% of respondents believe YouTube ads are more relevant compared to ads on traditional linear TV and other streaming platforms.
45. 66% of Marketers Plan to Boost YouTube Video Usage in Their Strategies.
As marketers evaluate their strategies, approximately 66% plan to boost their use of YouTube videos. Moreover, 59% aim to enhance their organic efforts on the platform, highlighting its growing significance in their marketing mix.
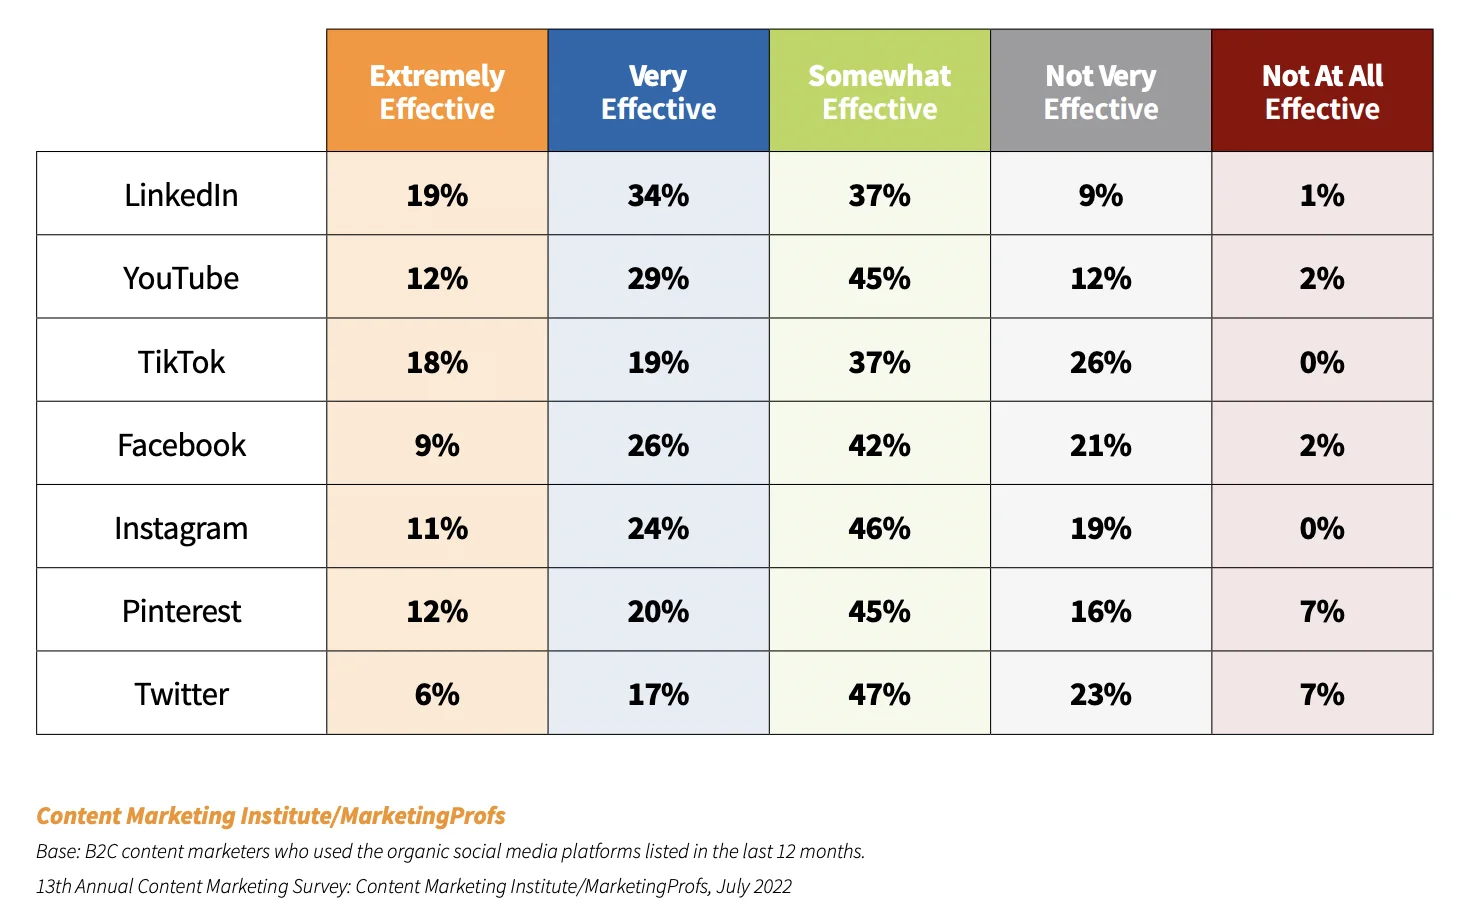
46.YouTube is Now the Second Most Effective Platform for B2C Content Marketing: 67% of Marketers Use It
The percentage of marketers leveraging YouTube for organic content marketing surged from 55% in 2022 to 67% in 2023. This increase underscores YouTube's growing importance as a powerful tool for B2C marketing, making it the second most effective platform after LinkedIn.
Social Media Purchasing Behavior
47. 76% of Social Media Users Have Made Purchases Inspired by Brands
According to Retail Touchpoints, a remarkable 76% of social media users have purchased items they discovered on these platforms. The buying journey varies, with 11% making instant purchases, 44% deferring online buys for later, and 21% choosing in-store options.
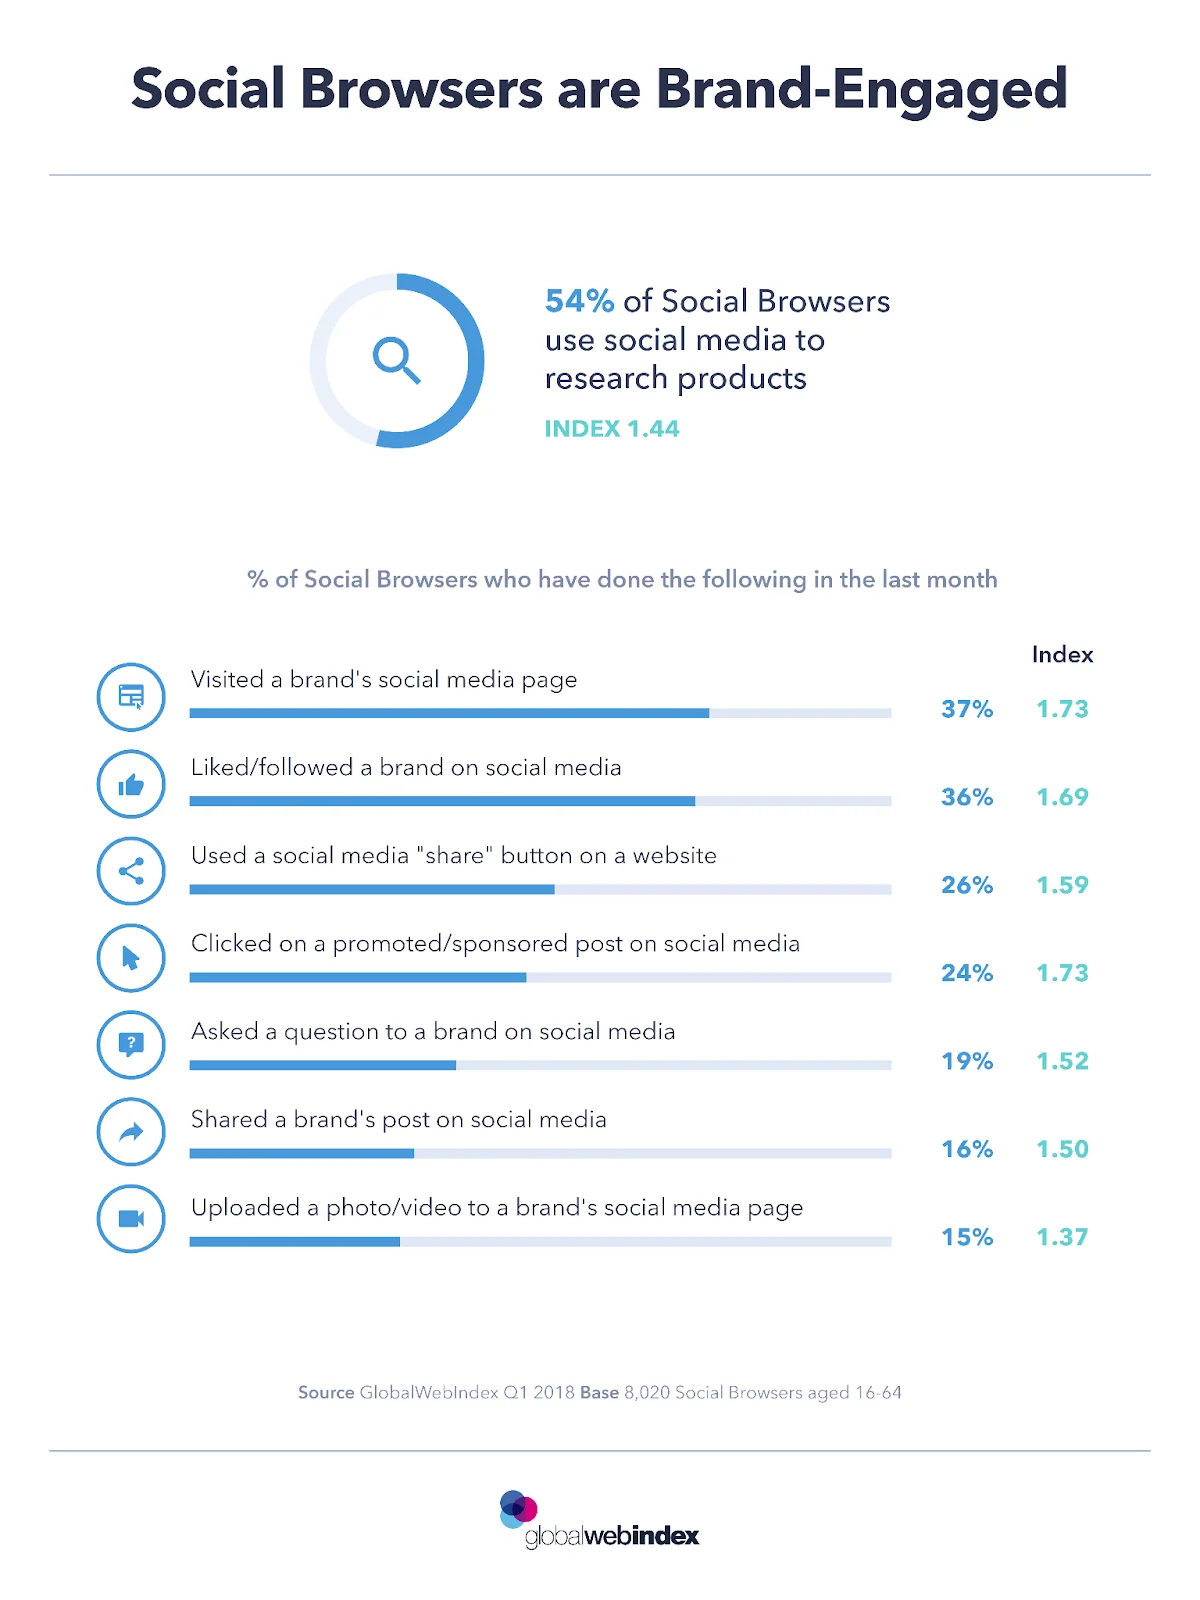
48. 54% of users research products on social media before making a purchase decision.
According to GlobalWebIndex, 54% of consumers turn to social media to research products prior to making a purchase decision. This trend highlights the pivotal role social media plays in the buyer's journey, as users seek reviews, recommendations, and detailed information about products.
Social Media Marketing Strategies
49. 80% of Brands Using AR Report Increased Sales
Research by Snap Inc. and Ipsos reveals that 80% of brands leveraging augmented reality (AR) report improvements in sales and performance metrics, alongside increased customer acquisition. This significant trend demonstrates the power of AR in enhancing customer engagement and providing immersive experiences that drive purchasing decisions.
50. 65% of Consumers Find AR Improves the Shopping Experience
A global report from Snap and Ipsos reveals that 65% of consumers believe augmented reality (AR) simplifies their shopping journey. Additionally, 79% express interest in interacting with AR products prior to making a purchase. This growing enthusiasm for AR highlights its potential to transform the retail landscape by providing consumers with immersive and informative experiences.
Social Media and E-commerce
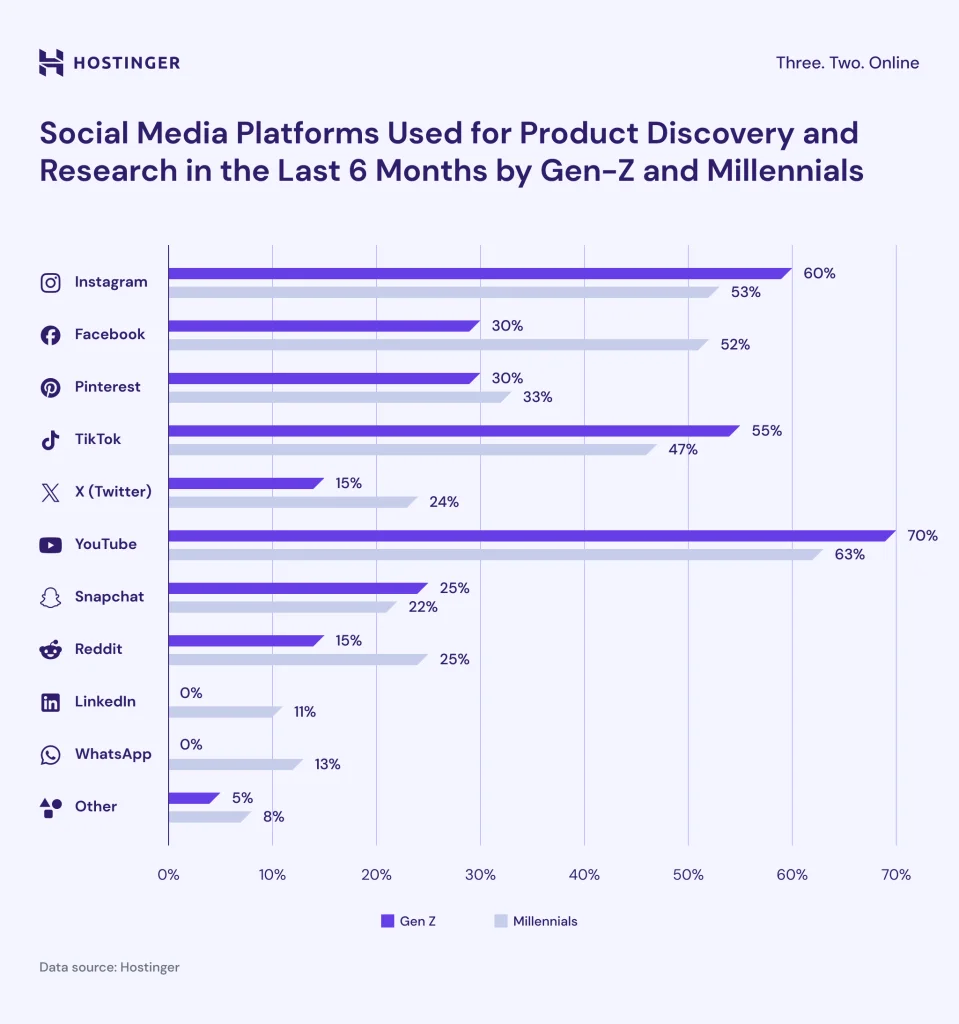
51. YouTube Leads Product Discovery for Gen Z and Millennials
According to the Hostinger Report, YouTube is the leading platform for product discovery, with 70% of Gen Z and 63% of Millennials relying on it to find new products. In contrast, 60% of Gen Z also prefer Instagram and 55% turn to TikTok. Meanwhile, Facebook appeals to only 30% of Gen Z. For Millennials, Instagram (53%) and TikTok (47%) are popular, but 52% still favor Facebook, indicating distinct generational preferences in social media for product exploration.
52. 80% of weekly Pinterest users have discovered new brands or products on the platform.
Did you know that 80% of weekly Pinterest users find new brands or products on the platform? This shows how effective Pinterest can be for discovering fresh offerings. If you want to connect with a highly engaged audience, leveraging Pinterest's visual appeal could be a game changer for showcasing your products and reaching potential customers.
Social Media and Brand Loyalty
53. 68% of consumers follow brands on social media to stay updated on products and promotions.
According to the Social Sprout Index, a notable 68% of consumers follow brands on social media to keep updated on products and promotions. This trend highlights the importance of having an active online presence. By sharing regular updates and exclusive offers, you can strengthen your connection with followers and enhance brand loyalty.
54. 62% of millennials are more likely to buy a product if the brand engages them on social media.
According to a study by Emerald, 62% of millennials are more inclined to purchase a product if the brand actively engages with them on social media. This statistic underscores the power of interaction in fostering brand loyalty. By connecting with your audience through meaningful conversations and engaging content, you can significantly boost your chances of driving sales.
LinkedIn statistics
55. Over 50% of LinkedIn Members’ Households Earn More Than $75,000
LinkedIn's user base showcases significant earning potential, with over half (53%) of its members in the U.S. reporting household incomes exceeding $75,000, according to a December 2022 survey. This marks an increase from the previous year, where 50% of users had similar income levels. The survey also revealed that 29% of users belong to middle-income households, while only 17% are categorized as low-income, highlighting LinkedIn's appeal to a more affluent audience.
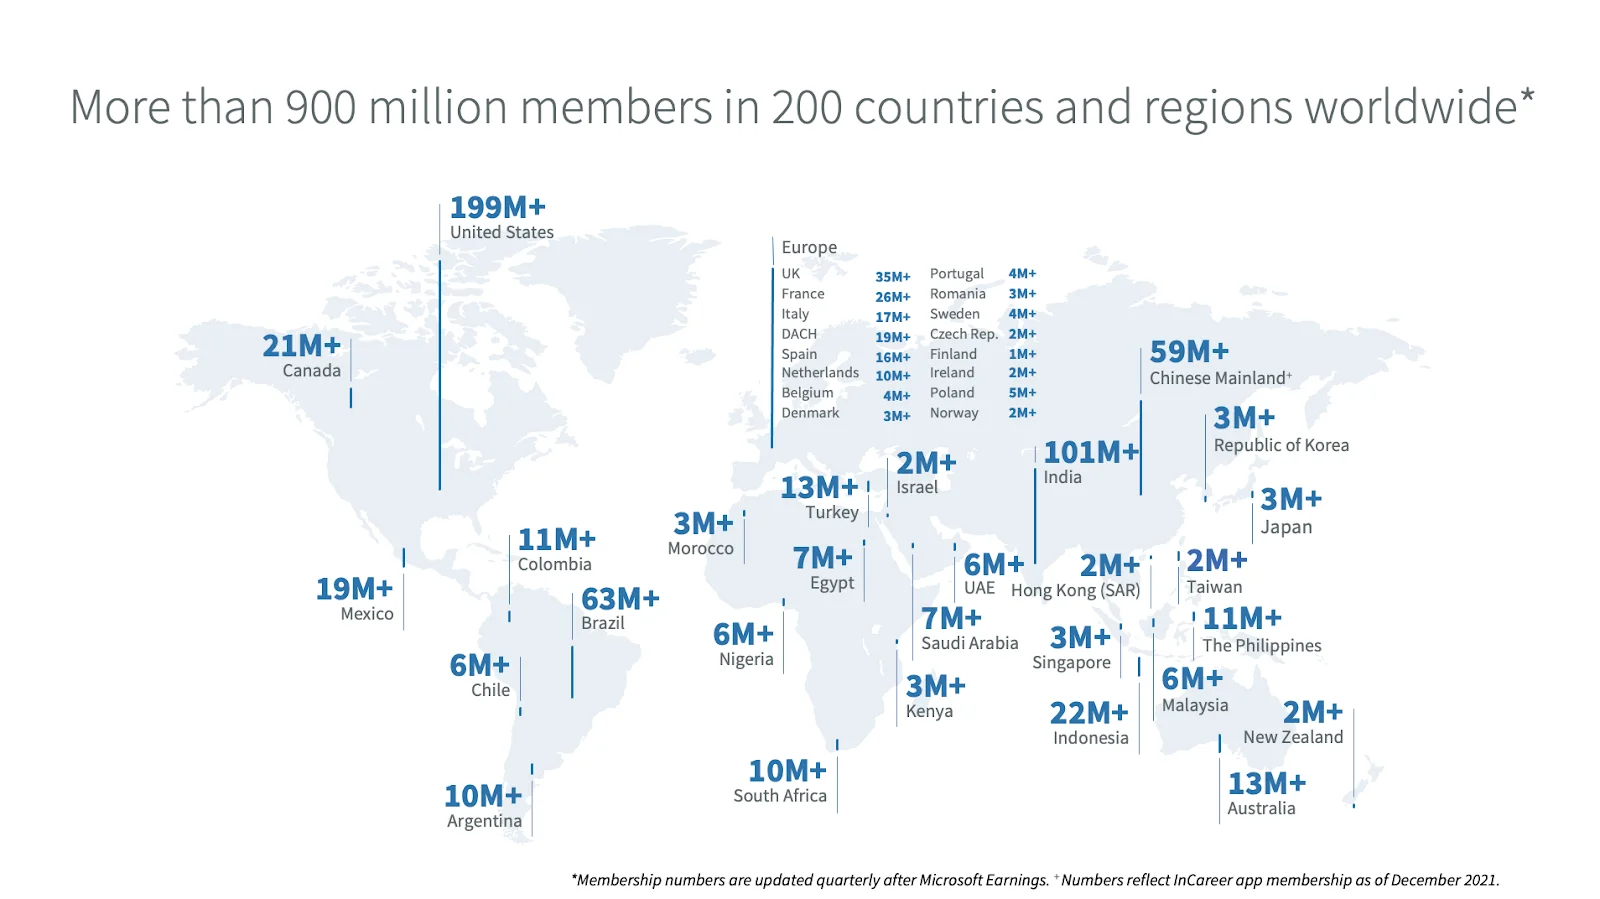
56. LinkedIn has more than 1 Billion members in 200 countries and regions
LinkedIn boasts a staggering membership of more than 1 Billion users, spanning across 200 countries and regions. This extensive network highlights the platform's significance in connecting professionals worldwide, making it an essential tool for job seekers, recruiters, and businesses aiming to expand their reach in the global market.
57. Most desktop traffic to LinkedIn comes from the US
Most desktop traffic to LinkedIn originates from the United States, accounting for 31.28% as of May 2022. Following the US, India contributes 7.08%, while the UK accounts for 5.99%. Brazil and Canada complete the top five sources of desktop traffic with 4.39% and 4.11%, respectively.
58. Over 137 Million US LinkedIn Members Active Daily
In December 2022, it was reported that 69% of US LinkedIn users log in daily, translating to over 137 million active daily members. Additionally, 15% use the platform several times a week, and 5% log in once a week. While the latest statistics do not provide average monthly users (MAU), projections for 2022 indicated that US MAU would reach 66.8 million, reflecting a growth of 2.1 million from 2021.
59. LinkedIn Ads Boost Purchase Intent by 33%
Advertising on LinkedIn leads to a 33% increase in purchase intent for brands. Brands can achieve a 2–3x lift in their brand attributes, while marketers see conversion rates up to 2x higher compared to other platforms.
60. LinkedIn is the #1 platform for B2B marketers
A LinkedIn study reveals that it’s the top platform for lead generation, with 4 out of 5 of its 1 billion members influencing business decisions—over 800 million individuals! Additionally, LinkedIn users possess twice the buying power of the average online audience, making it an invaluable resource for your marketing strategy.
Leverage these vital Social Media Marketing Statistics
As we all know, data plays a crucial role in shaping effective social media marketing strategies. The insights provided above highlight the importance of understanding trends and audience behaviors. By leveraging this information, you can optimize your campaigns, boost engagement, and achieve better results for your brand.
It’s time you incorporate data-driven decisions instead of relying solely on intuition. By analyzing these vital statistics, you can refine your strategies, target your audience more effectively, and stay ahead of the competition.

.png)
.png)
.png)