Limited Time Offer: Get Flat 50% OFF on Growth Annual Plan | Upgrade Now

What is Twitter Analytics?

Twitter Analytics provides a range of data points about the performance of your tweets and audience engagement. Your dashboard offers insights into profile growth, including visits, follows, and mentions. It also tracks key metrics for each tweet, such as engagements, impressions, link clicks, replies, and retweets.

‍

More Twitter Analytics

‍

Twitter Analytics is like a magic mirror for your Twitter account, showing you how your tweets are performing and revealing key insights that help you refine your strategy. It provides a detailed view of profile growth, including visits, follows, and mentions. Plus, it tracks essential metrics for each tweet—engagements, impressions, link clicks, replies, and retweets.

By analyzing this data through the lens of the Twitter algorithm, you can discover your most loyal followers and identify the best times to post, helping you optimize your social media presence.


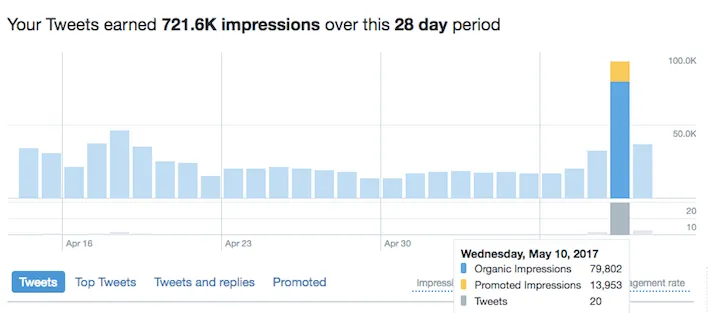
Let’s check out an example screenshot of Twitter Analytics:

‍

‍
Here’s how you can access Twitter Analytics:

On Desktop:

  1. Head over to analytics.twitter.com or click on “More” from your profile sidebar, then select “Analytics.”
  2. If you don’t see your dashboard, click “Get Started.”


On Mobile:

  1. Find the tweet you want to analyze.
  2. Tap the bottom right corner of that tweet.

‍

Let’s check out 15 must-know Twitter Analytics stats:

Let’s check out some super helpful Twitter Analytics stats that can really boost your tweeting:

  1. Monthly Performance Overview - Your dashboard’s homepage shows a 28-day performance overview. It highlights top tweets, mentions, followers, and media tweets. Use these insights to reshare popular content and thank new followers!
    ‍
  2. Trend Insights - Spot trends in your performance to see how well your strategies are working. Look for spikes or dips and ask questions like, “What caused this?” to adjust your tactics accordingly.
    ‍
  3. Average Tweet Performance - Track your average tweet performance to set benchmarks. This smooths out daily fluctuations and helps you see if you’re improving over time.
    ‍
  4. Type of Engagement - Different types of engagement (likes, retweets, link clicks) give you clues about what resonates with your audience. Check these to understand your tweet’s impact.
    ‍
  5. Engagement Rate - This is the number of engagements divided by total impressions. It helps you see how well your tweets are performing compared to how many people saw them.
    ‍
  6. Top Influential Sharers - Identify followers with large followings who regularly retweet your content. Engaging with them can expand your reach.
    ‍
  7. Tweet Length vs. Engagement - Analyze how tweet length affects engagement. This helps you find the sweet spot for your audience.
    ‍
  8. Tweet Reach Percentage - Find out what percentage of your followers are seeing your tweets. Use this to determine if you should reshare more often.
    ‍
  9. Tweet Reach Including Retweets - Calculate your tweet’s potential reach by including the followers of those who retweeted. This shows you the broader impact of your tweets.
    ‍
  10. Hashtag Comparison - Compare the performance of hashtags to see which ones drive more engagement and reach.
    ‍
  11. Tweet Impressions by Time of Day - Discover the best times to tweet by analyzing when your tweets get the most impressions.
    ‍
  12. Engagement Rate by Time of Day - Find out when your audience is most engaged with your tweets to optimize your posting schedule.
    ‍
  13. Best Days for Twitter Engagement - Analyze which days of the week your tweets get the most engagement and adjust your posting schedule accordingly.
    ‍
  14. Video Completion Rates - For video tweets, check the completion rate to see how many viewers watched your video all the way through.
    ‍
  15. Number of Conversions - If you’re running Twitter Ads, track how many users take the desired action (like app installs or signups) to gauge the effectiveness of your campaigns.


Twitter Analytics is a powerful tool that helps you understand what’s working and what’s not. By keeping an eye on these stats, you can refine your strategy and engage with your audience more effectively. So, dive in and start exploring—there’s a lot of fun data waiting for you!

‍

Related Terms

Frequently asked questions

What is the Post Activity Dashboard?

The Post Activity Dashboard on Twitter provides a detailed view of how individual tweets are performing. It tracks metrics such as engagements, impressions, link clicks, and media views, allowing you to gauge how well your content is resonating with your audience and make data-driven adjustments to your strategy.

Can I access the dashboard directly?

Yes, you can access the Post Activity Dashboard directly through Twitter Analytics. Simply log in to your Twitter account, go to the Analytics section, and navigate to the "Tweets" tab to view detailed performance metrics for your individual posts.

How can I view Twitter Analytics from a desktop?

To view Twitter Analytics from a desktop, start by logging in to your Twitter account. Next, click on your profile icon located in the top right corner of the screen. From the dropdown menu, select "Analytics." This will take you to the Twitter Analytics dashboard, where you can access detailed insights into your Tweet performance, engagement metrics, and audience behavior.

How can I view Twitter Analytics from a mobile device?

To view Twitter Analytics from a mobile device, open the Twitter app and log in to your account. Tap on your profile icon in the top left corner to open the menu. From the options, select "Analytics." This will direct you to the Twitter Analytics page, where you can explore your Tweet performance, engagement statistics, and audience insights directly from your mobile device.

Get started for free

Try vidyo.ai now